LESS, a project I'm currently hacking on @work, has a unit test suite that was a pain to use because the ~80 tests took 45 seconds to run. The problem with that test suite is that you just don't run it often enough during development because it's just too long.
Running the specific test cases for the part of the application you're working on is easy and fast, but that does not tell you when changes in part A of the app break part B - which happened several times, and all just because I didn't want to wait 45 seconds again and again.
So a solution was badly needed; tests should be as fast as possible; preferably < 10 seconds. Before being able to make the slow tests faster, I had to find out which of the 80 tests were slow.
Finding timing information
Now when you're using a CI system like CruiseControl or Jenkins, you do of course have nice reports that tell you which tests get executed, where it fails and what time they took to run. The normal PHPUnit output does not show any timing information, and manually grepping the output of the --log-junit file - which contains timing information - wasn't something that I want to do if I can get pretty reports.
I don't have CI for LESS yet, so I needed some tool that generated pretty reports with timing details instantly on the command line.
Reporting tools
All web searches for "phpunit reporting" led to pages that talk about coverage reports, but not a single one told me how to visualize normal phpunit test runs without coverage. The human readable normal output formats do not show timing information.
Since PHPUnit supports JUnit log file output, I thought that I also could use some JUnit reporting system. It turned out that there are some commercial ones that generate pretty PDFs, but I didn't need anything too fancy (and closed source, and I didn't want to buy anything). Only relatively late I stumbled across the ant junitreport task which promised to do what I wanted.
junitreport
So I generated the junit log file using
$ phpunit --log-junit log.junit.xml
and wrote an ant build file that used that XML file as input:
]]>
Unfortunately, ant told me
$ ant gen-report: [junitreport] the file log.junit.xml is not a valid testsuite XML document ... BUILD SUCCESSFUL
So we know now that PHPUnit's junit-compatible XML files are not junit compatible.
The reson for this error, as I found out later, is that PHPUnit's XML file contains multiple testsuite results, while JUnit's XML only contains one single test suite in one XML file.
Update 2016-10
You could use the XSL file I found on Creating a build agent and definition for PHP in VSTS to make them compatible:
<?xml version="1.0" encoding="UTF-8"?>
<xsl:stylesheet version="1.0" xmlns:xsl="http://www.w3.org/1999/XSL/Transform">
 <xsl:template match="/">
  <xsl:element name="testsuites">
   <xsl:for-each select="//testsuite[@file]">
    <xsl:copy-of select="." />
   </xsl:for-each>
  </xsl:element>
 </xsl:template>
</xsl:stylesheet>
phpunitreport
Disappointed by junitreport, I remembered our good old PHP build tool: Phing. And indeed, Phing ships a phpunitreport task!
Naturally, it works with PHPUnit style junit xml files. The phing task is easy to setup:
]]>
An error
Running phing to generate the report, I got - again - an error:
gen-report: [PHP Error] XSLTProcessor::importStylesheet(): error [line 135 of phing/tasks/ext/phpunit/PHPUnitReportTask.php] [PHP Error] XSLTProcessor::importStylesheet(): Local file read for phing/etc/str.replace.function.xsl refused [line 135 of phing/tasks/ext/phpunit/PHPUnitReportTask.php] [PHP Error] XSLTProcessor::importStylesheet(): error [line 135 of phing/tasks/ext/phpunit/PHPUnitReportTask.php] [PHP Error] XSLTProcessor::importStylesheet(): xsltLoadStyleDocument: read rights for phing/etc/str.replace.function.xsl denied [line 135 of phing/tasks/ext/phpunit/PHPUnitReportTask.php] ]]>
Reason for it was that I had the redland PHP extension enabled; it adds restrictions to XSLT. Disabling it made report generation work.
Output
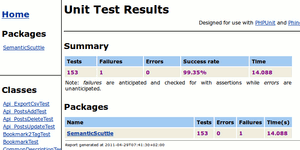
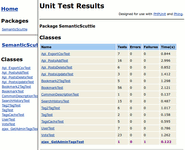
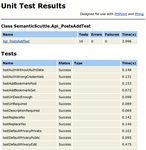
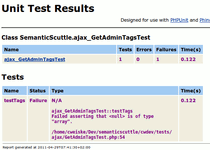
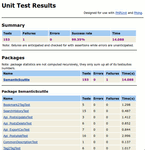
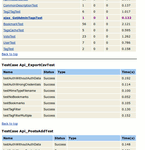
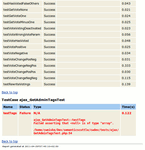
It supports a framed and a single page version (noframes). Here some screenshots:
Single page view:
Results
Now that I had the report and saw which test suites took most time, I could identify seven test methods that took about 5 seconds each. They used an RDF file to get example data - but that file was 1.1MiB huge. Parsing it took most of the time.
After replacing the file with a customized version that contains only the tags needed, all tests run at < 0.1 seconds now. Running the whole suite takes 10 seconds, and running all tests is fast enough now to do it again and again.
